
New Publication: 19 Years of Sea Turtle Monitoring in Florida Bay
I’m excited to share that our new journal article on sea turtle demography in Florida Bay has just been published in Endangered Species Research!
The Paper
Foley, A. M., Witherington, B. E., McDonald, T. L., Hirama, S., Hardy, R. F., & Schroeder, B. A. (2026). Determining abundance and survival of sea turtles at foraging areas: a logistically feasible field approach using multiple analytical methods. Endangered Species Research, 60, esr01502. https://doi.org/10.3354/esr01502
What We Did
Long-term monitoring of sea turtles at foraging areas is widely recognized as important, but surprisingly few studies have actually pulled it off. This paper reports on 19 years of continuous monitoring (2000–2018) of loggerhead (Caretta caretta) and green turtles (Chelonia mydas) in Florida Bay, Florida. Our goal was to demonstrate a cost-effective, logistically feasible approach that other researchers and managers could replicate in similar conditions.
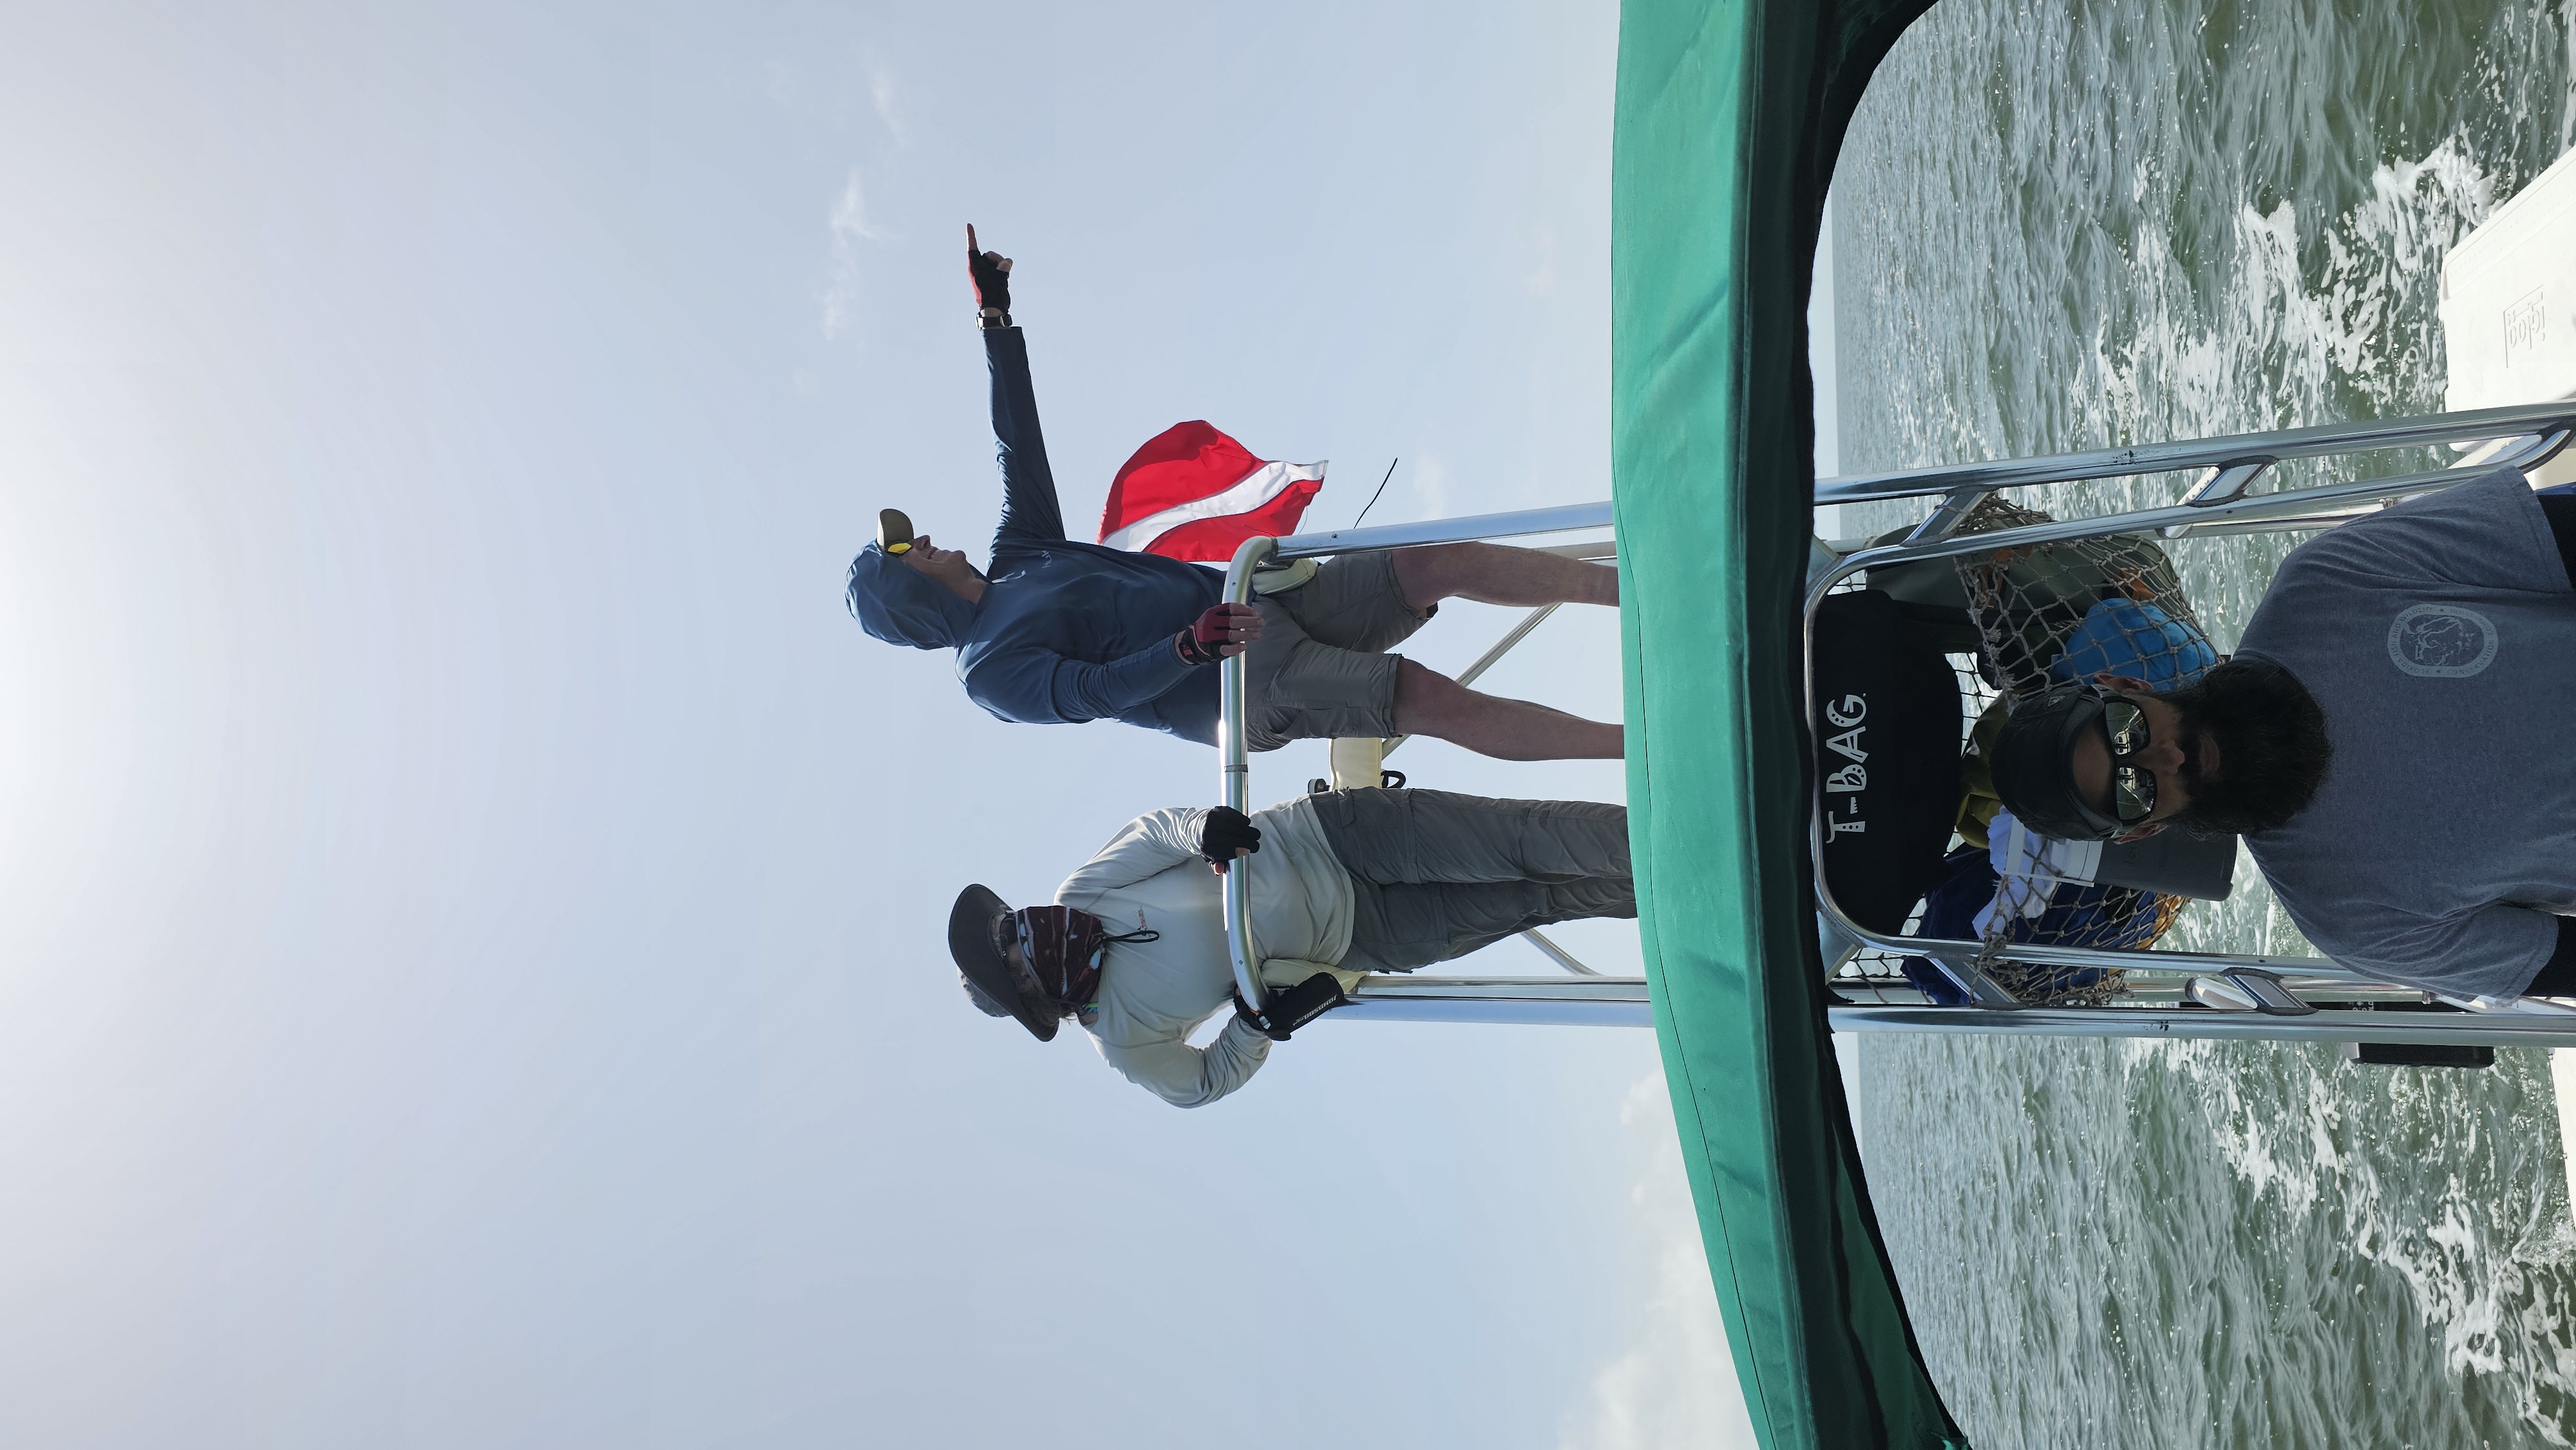
Co-author McDonald — a statistician by trade, with eyesight to match — confidently spots a turtle from the observation tower. His fellow observer remains unconvinced.
Each year we ran transect surveys over 4–10 day field periods, covering a mean of about 200 km of tracklines annually. Observers stationed on elevated platforms scanned the water ahead and to the sides of the vessel while the boat followed haphazard unmarked nonlinear transects (HUNTs; Bresette et al. 2010) — a design well suited to the shallow, irregular geography of Florida Bay. Each time a turtle was spotted, observers estimated the perpendicular distance from the trackline to the animal’s original location. These distance estimates are the raw material for our first abundance method, distance sampling (Buckland et al. 2015), which uses the drop-off in detection rate with increasing distance from the transect to model the fraction of turtles missed and produce a corrected population estimate. Distance sampling yielded annual mean estimates of 537 loggerheads and 378 green turtles — figures that proved reassuringly consistent with the two mark-recapture methods applied to turtles we brought aboard.
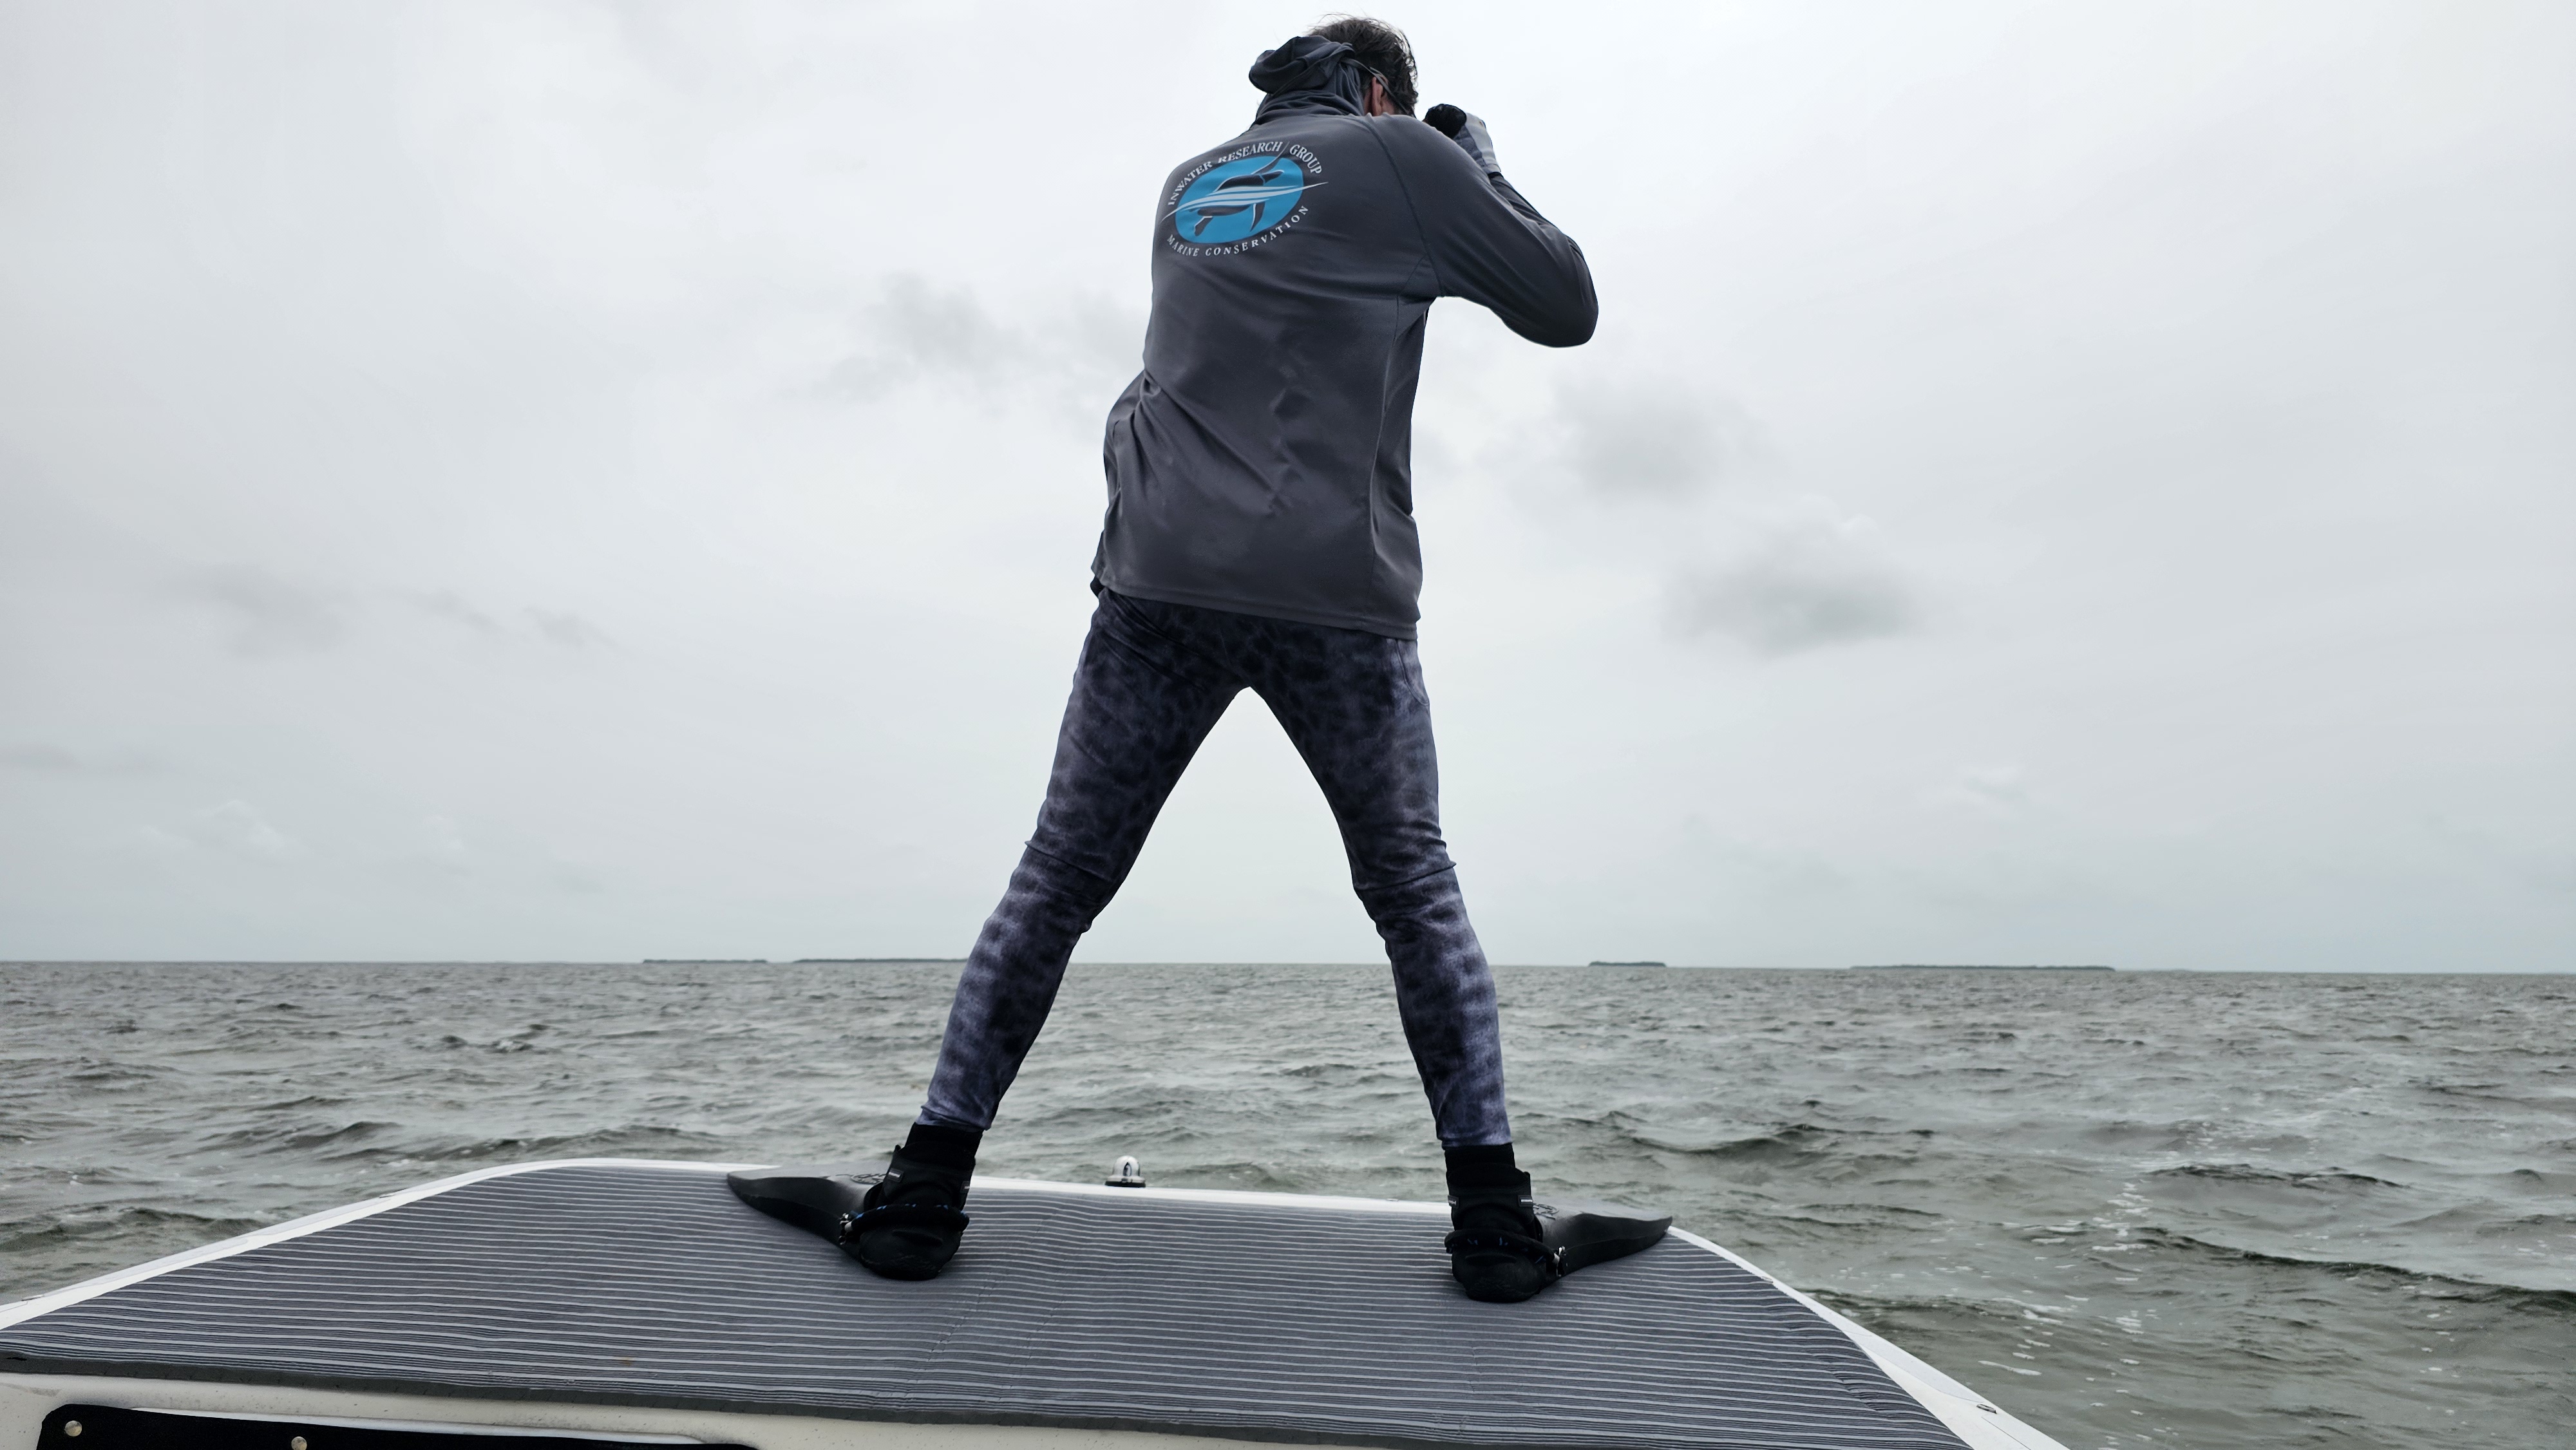
A field crew member readies to dive from the bow of the research vessel to hand-capture a loggerhead spotted below the surface.
Over the study period, we captured loggerheads 1,320 times, representing 886 individual turtles. Each capture involved bringing the turtle aboard for processing before release.
In the Field: Capturing and Processing Turtles
Once a turtle was spotted and the boat maneuvered close, the real work began. Each animal was brought aboard and processed to collect a suite of measurements and biological data. Among those measurements, blood sample chemistry helped identify sex and genetic identity.
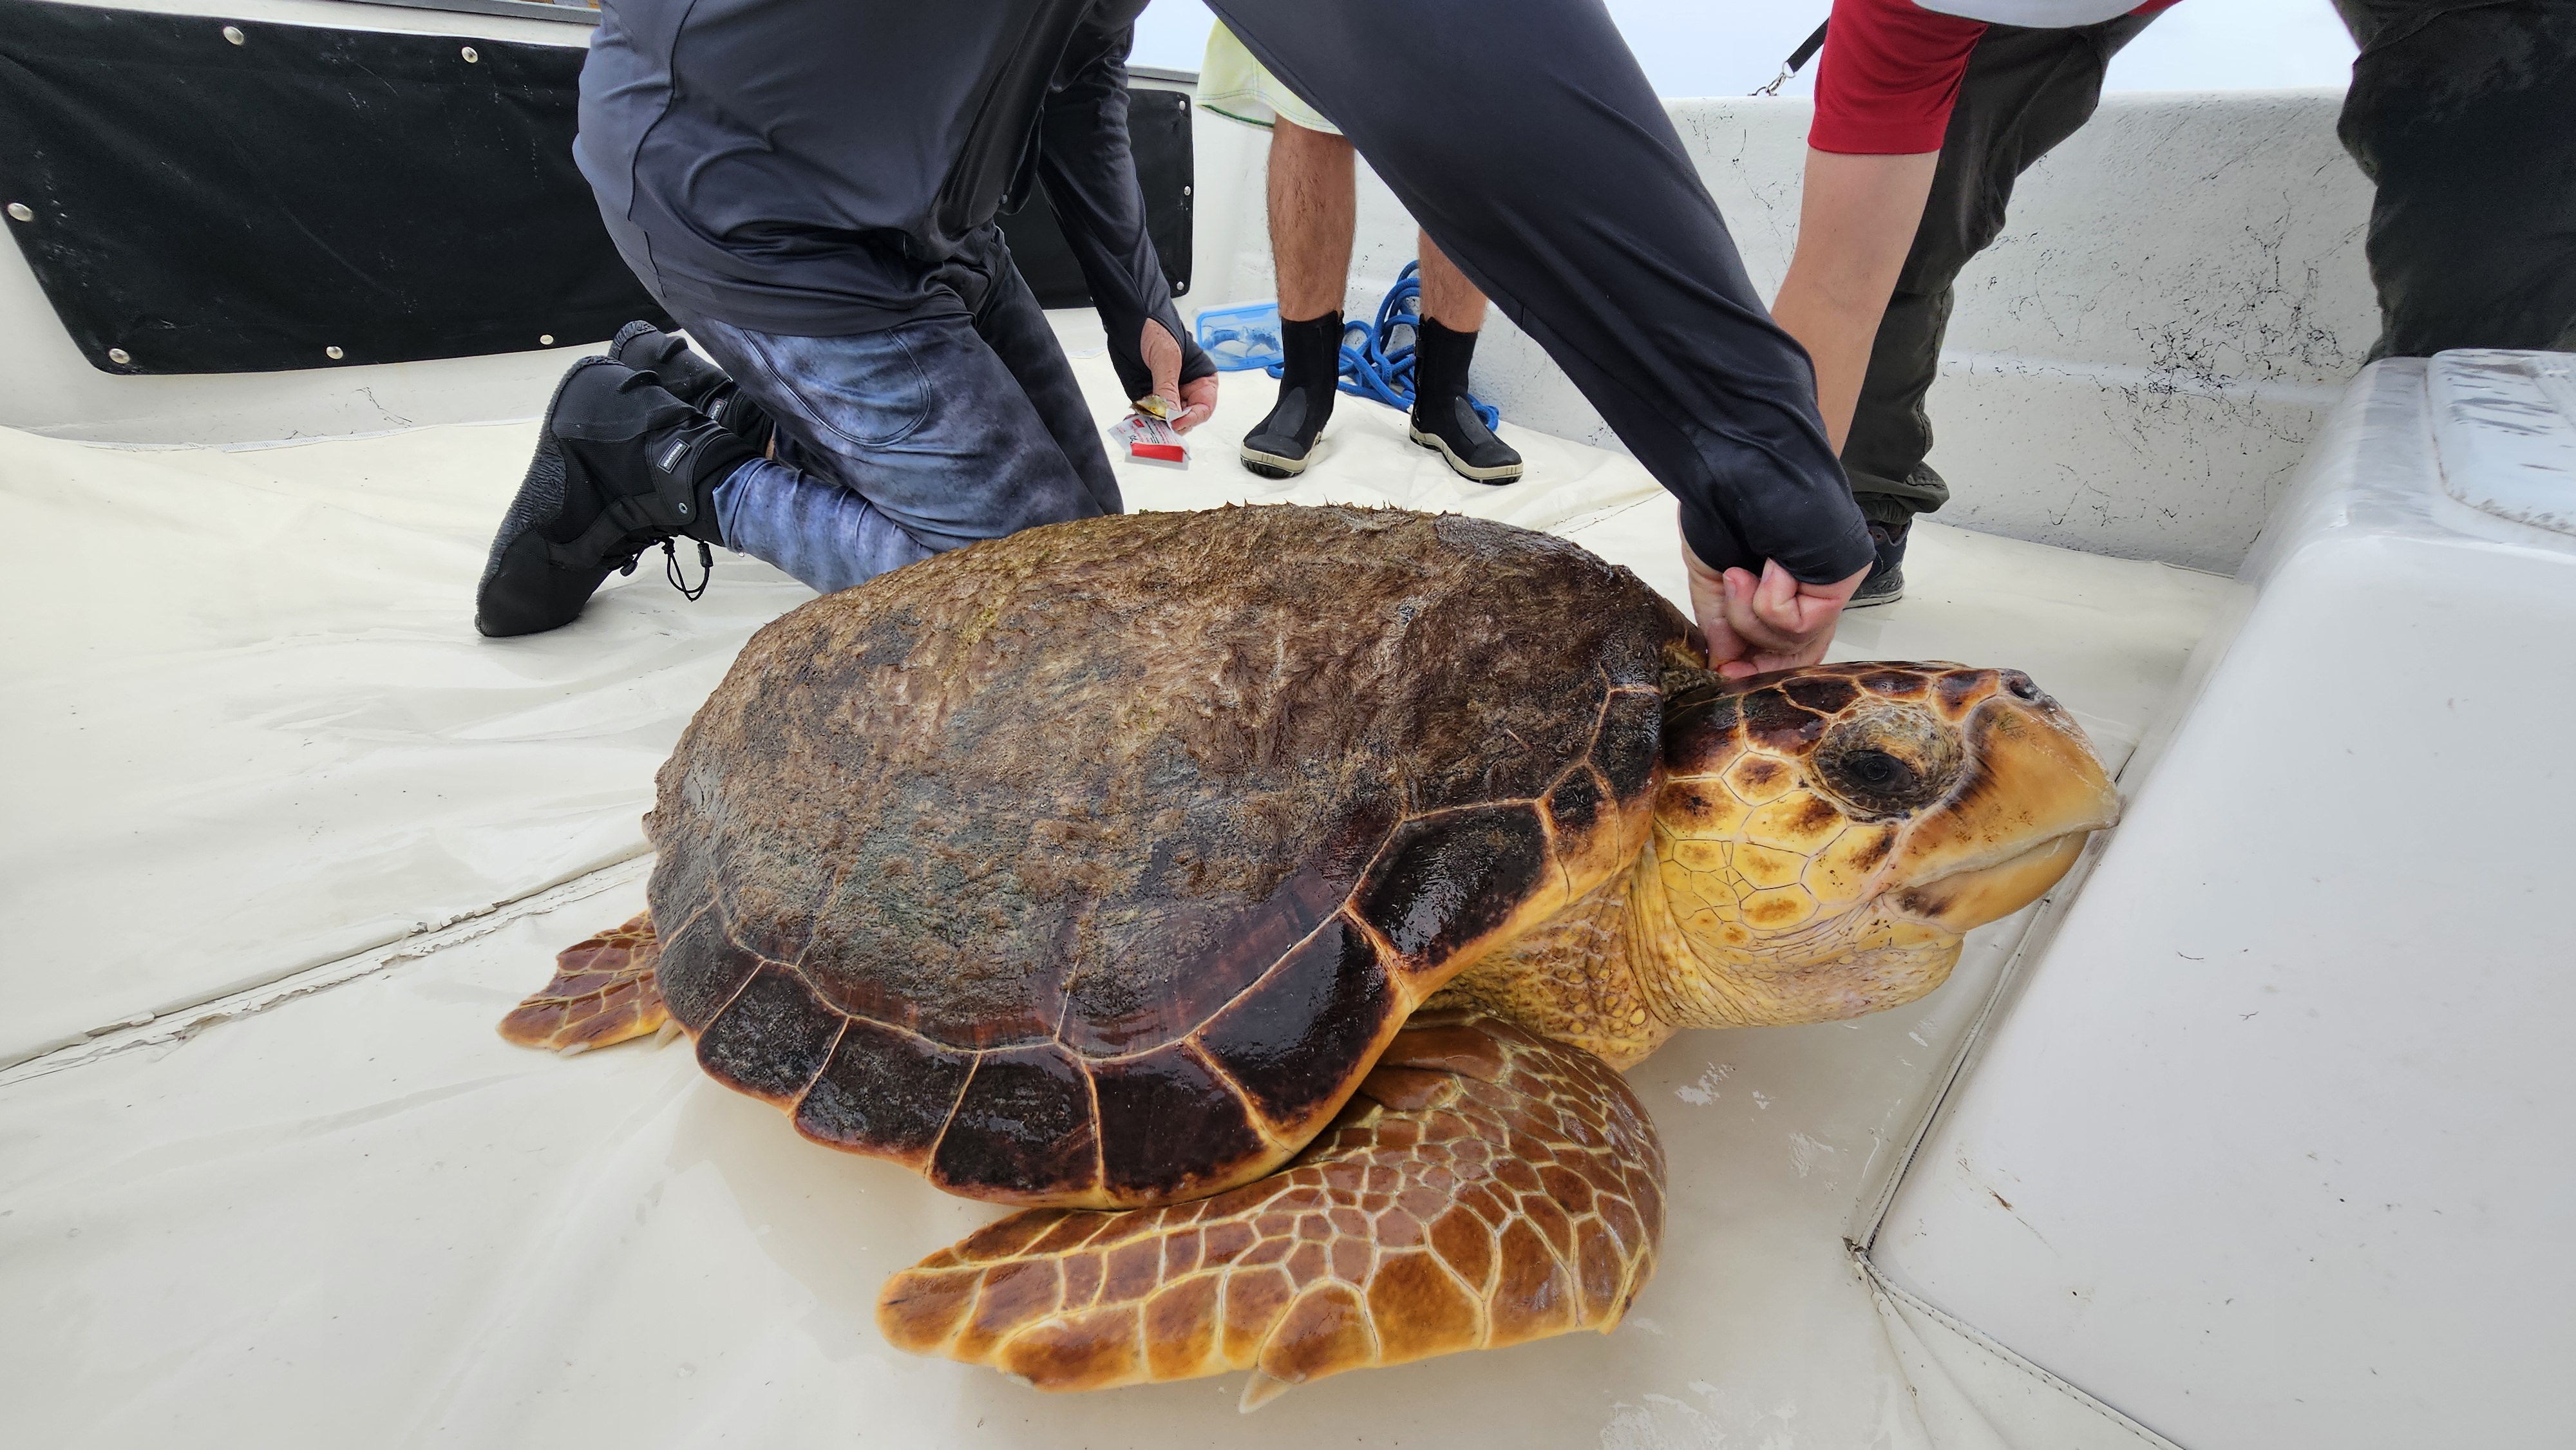
A loggerhead sea turtle rests on deck while the crew prepares for blood sample collection. This work was conducted under State of Florida Marine Turtle Permit MTP-124, Everglades National Park Permit EVER 2001-SCI-0053, EVER-2003-SCI-0002, EVER-2004-SCI-0064, EVER-2005-SCI-0060, EVER-2007-SCI-0045, EVER-2009-SCI-0047, EVER-2011-SCI-0023, EVER-2012-SCI-0030, EVER-2013-SCI-0040, EVER-2012-SCI-0030, EVER-2013-SCI-0040, EVER-2015-SCI-0042, EVER-2017-SCI-0039, and EVER-2025-SCI-0014 and National Marine Fisheries Service ESA permits 1198, 1501, 14622, 19637, 25691.
Straight-line carapace length was measured with calipers as a standard index of body size, helping us classify individuals as immature or adult and providing data on the growth of recaptured individuals.
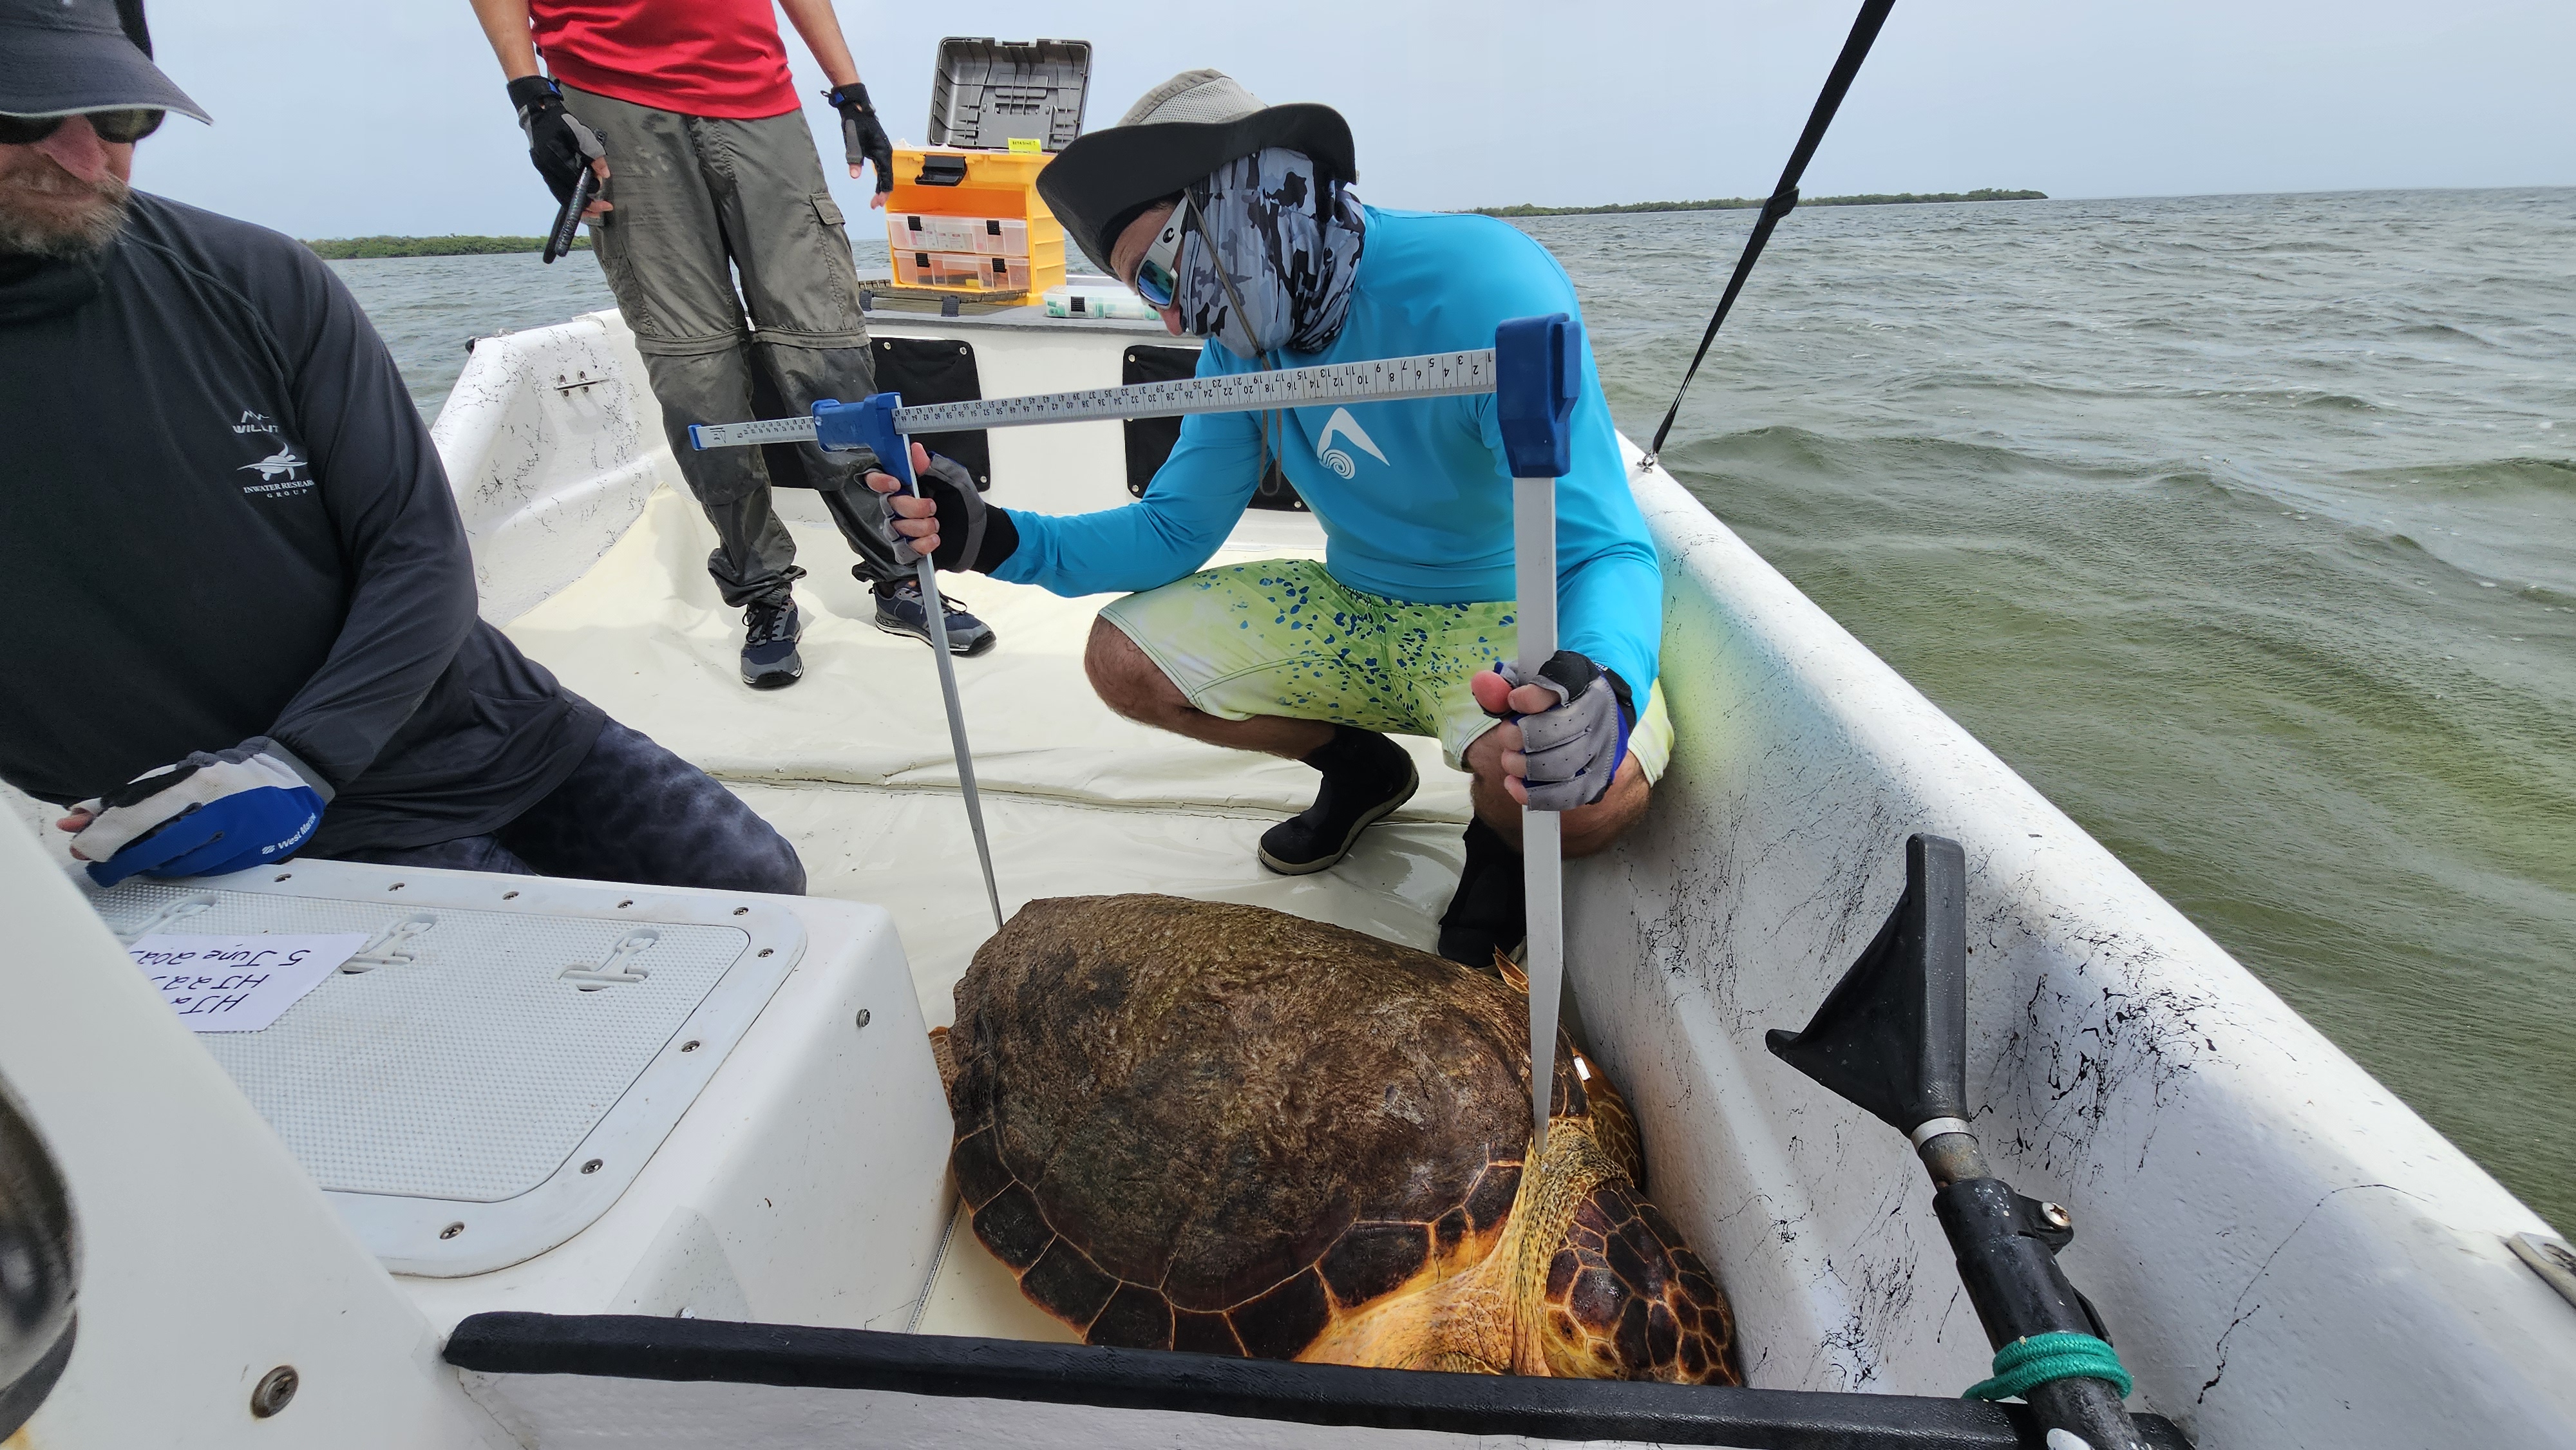
Crew members measure straight-line carapace length – a standard index of body size. This work was conducted under State of Florida Marine Turtle Permit MTP-124, Everglades National Park Permit EVER 2001-SCI-0053, EVER-2003-SCI-0002, EVER-2004-SCI-0064, EVER-2005-SCI-0060, EVER-2007-SCI-0045, EVER-2009-SCI-0047, EVER-2011-SCI-0023, EVER-2012-SCI-0030, EVER-2013-SCI-0040, EVER-2012-SCI-0030, EVER-2013-SCI-0040, EVER-2015-SCI-0042, EVER-2017-SCI-0039, and EVER-2025-SCI-0014 and National Marine Fisheries Service ESA permits 1198, 1501, 14622, 19637, 25691.
Data recording was a team effort. While two to three crew member handled the turtle, others filled out datasheets recording everything from capture location to morphometric observations.
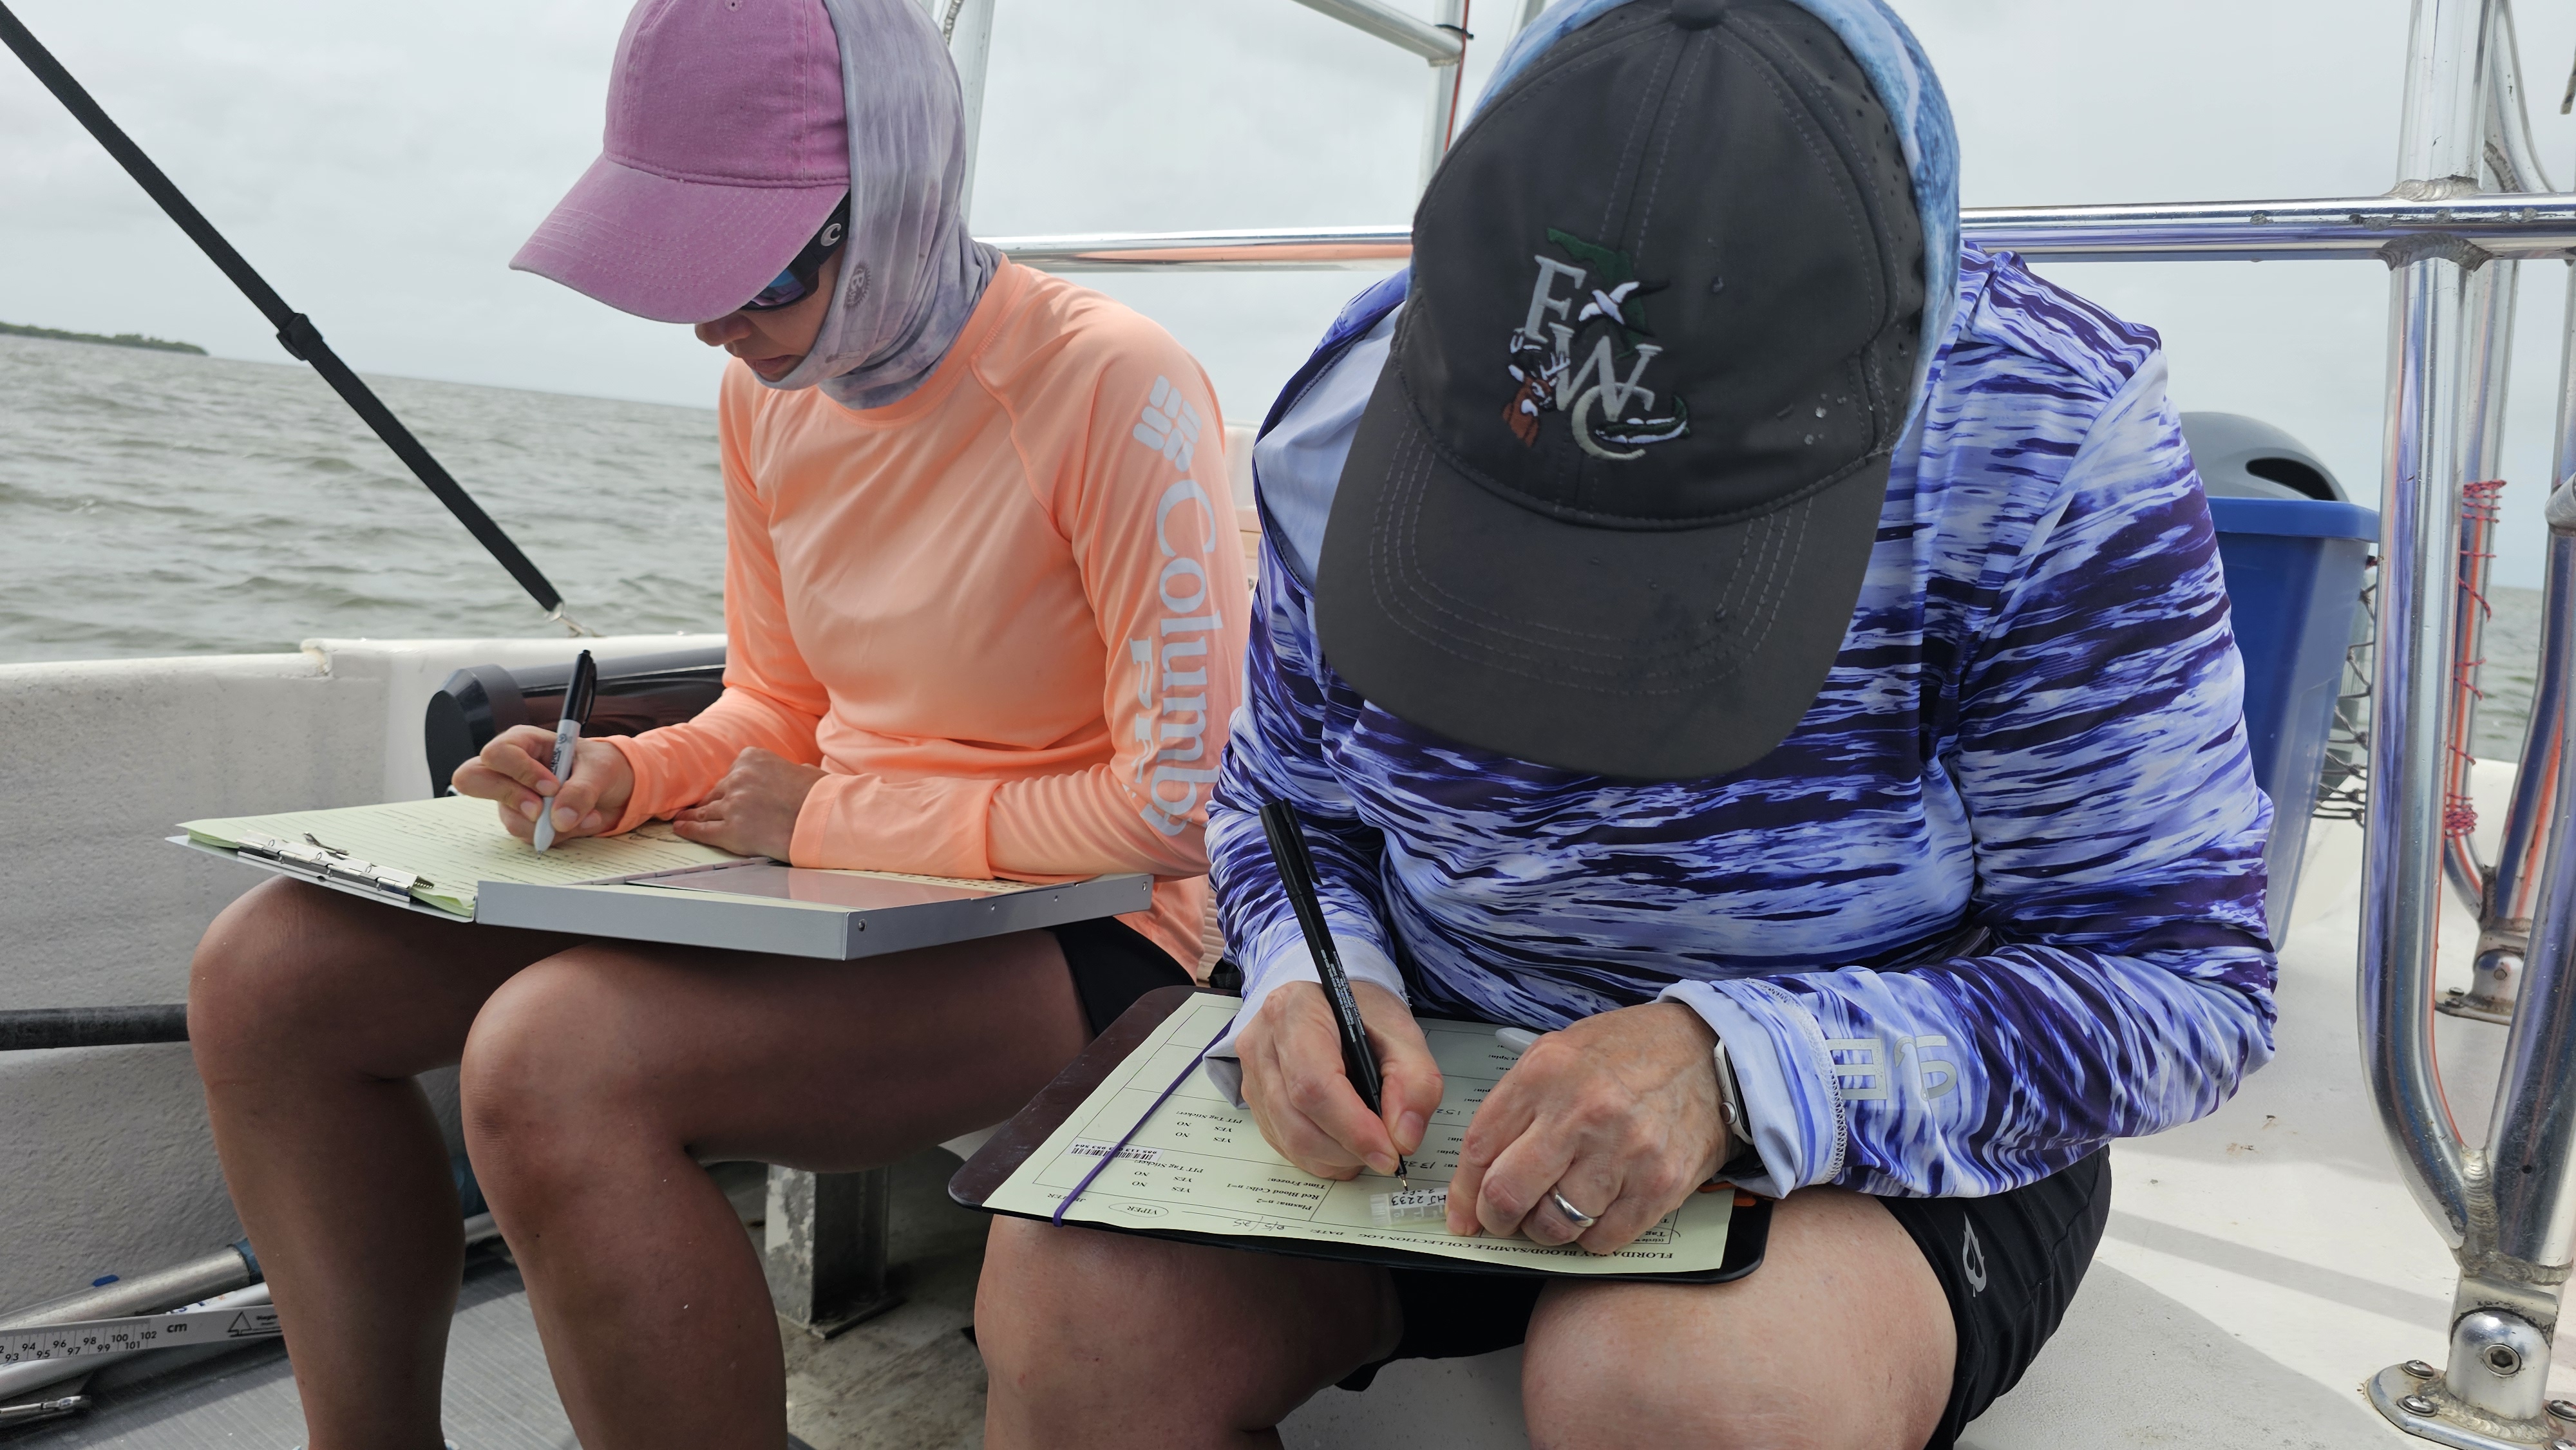
Two field crew members recording data during a turtle capture event.
Body mass was recorded using a hanging scale — an important complement to length measurements for assessing body condition.
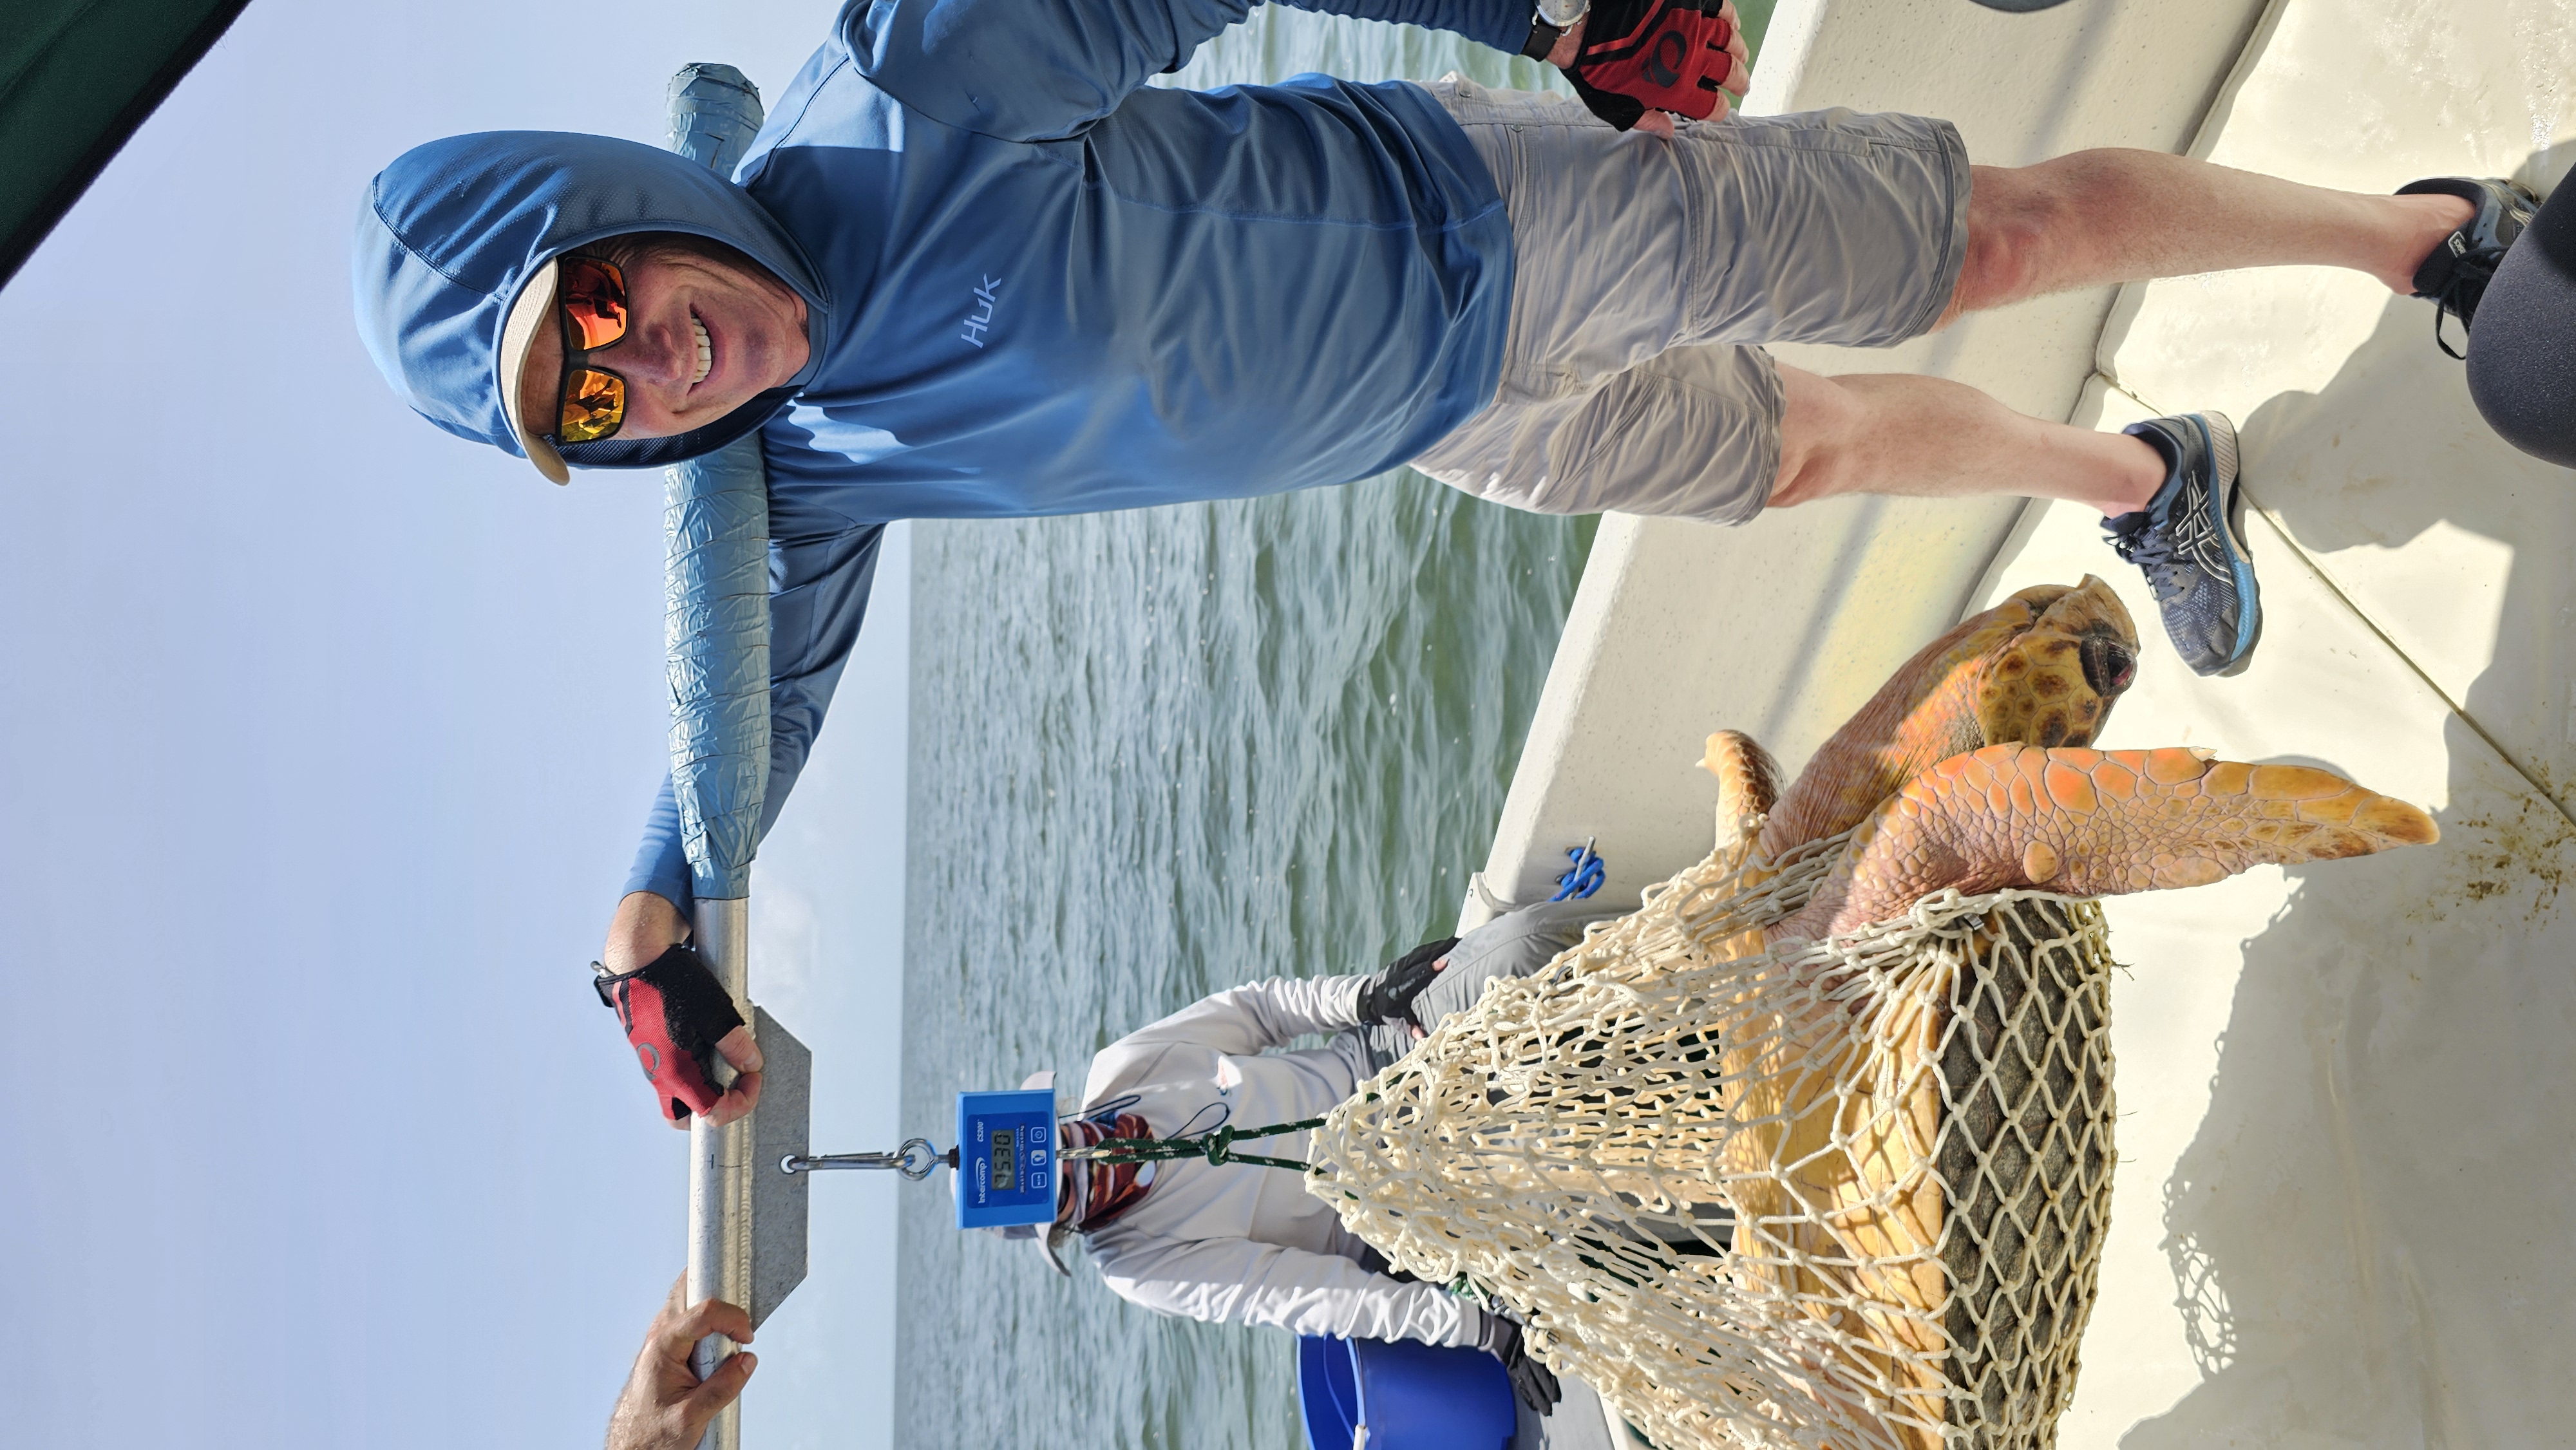
Co-author McDonald lends a hand as the crew weighs a captured loggerhead on a hanging digital scale. Loggerheads in our study area typically weigh between 150 and 350 pounds (68–159 kg) – at 166 pounds (75.3 kg) this one is at the low end of the range. This work was conducted under State of Florida Marine Turtle Permit MTP-124, Everglades National Park Permit EVER 2001-SCI-0053, EVER-2003-SCI-0002, EVER-2004-SCI-0064, EVER-2005-SCI-0060, EVER-2007-SCI-0045, EVER-2009-SCI-0047, EVER-2011-SCI-0023, EVER-2012-SCI-0030, EVER-2013-SCI-0040, EVER-2012-SCI-0030, EVER-2013-SCI-0040, EVER-2015-SCI-0042, EVER-2017-SCI-0039, and EVER-2025-SCI-0014 and National Marine Fisheries Service ESA permits 1198, 1501, 14622, 19637, 25691.
A cornerstone of our long-term capture work was tagging each turtle with a Passive Integrated Transponder (PIT) tag placed in the front flipper — the same technology used in pet microchips. PIT tags provide permanent, positive identification if the same individual is captured again in later years, whether by our team or by other researchers anywhere in the world. Such recaptures are the foundation of mark-recapture analyses.
Before release, we also marked each turtle with a temporary visible identifier to support re-sights within the same sampling season. Within-season re-sights allowed us to apply our second abundance method: closed population Schnabel censuses (Schnabel 1938, Chao and Huggins 2005), which assume the population does not change during our short field season. The location and timing of recaptures across years then enabled our third method — open spatially explicit capture-recapture models (Borchers and Efford 2008) — which account for animals moving in and out of the study area and yield both abundance and survival estimates.
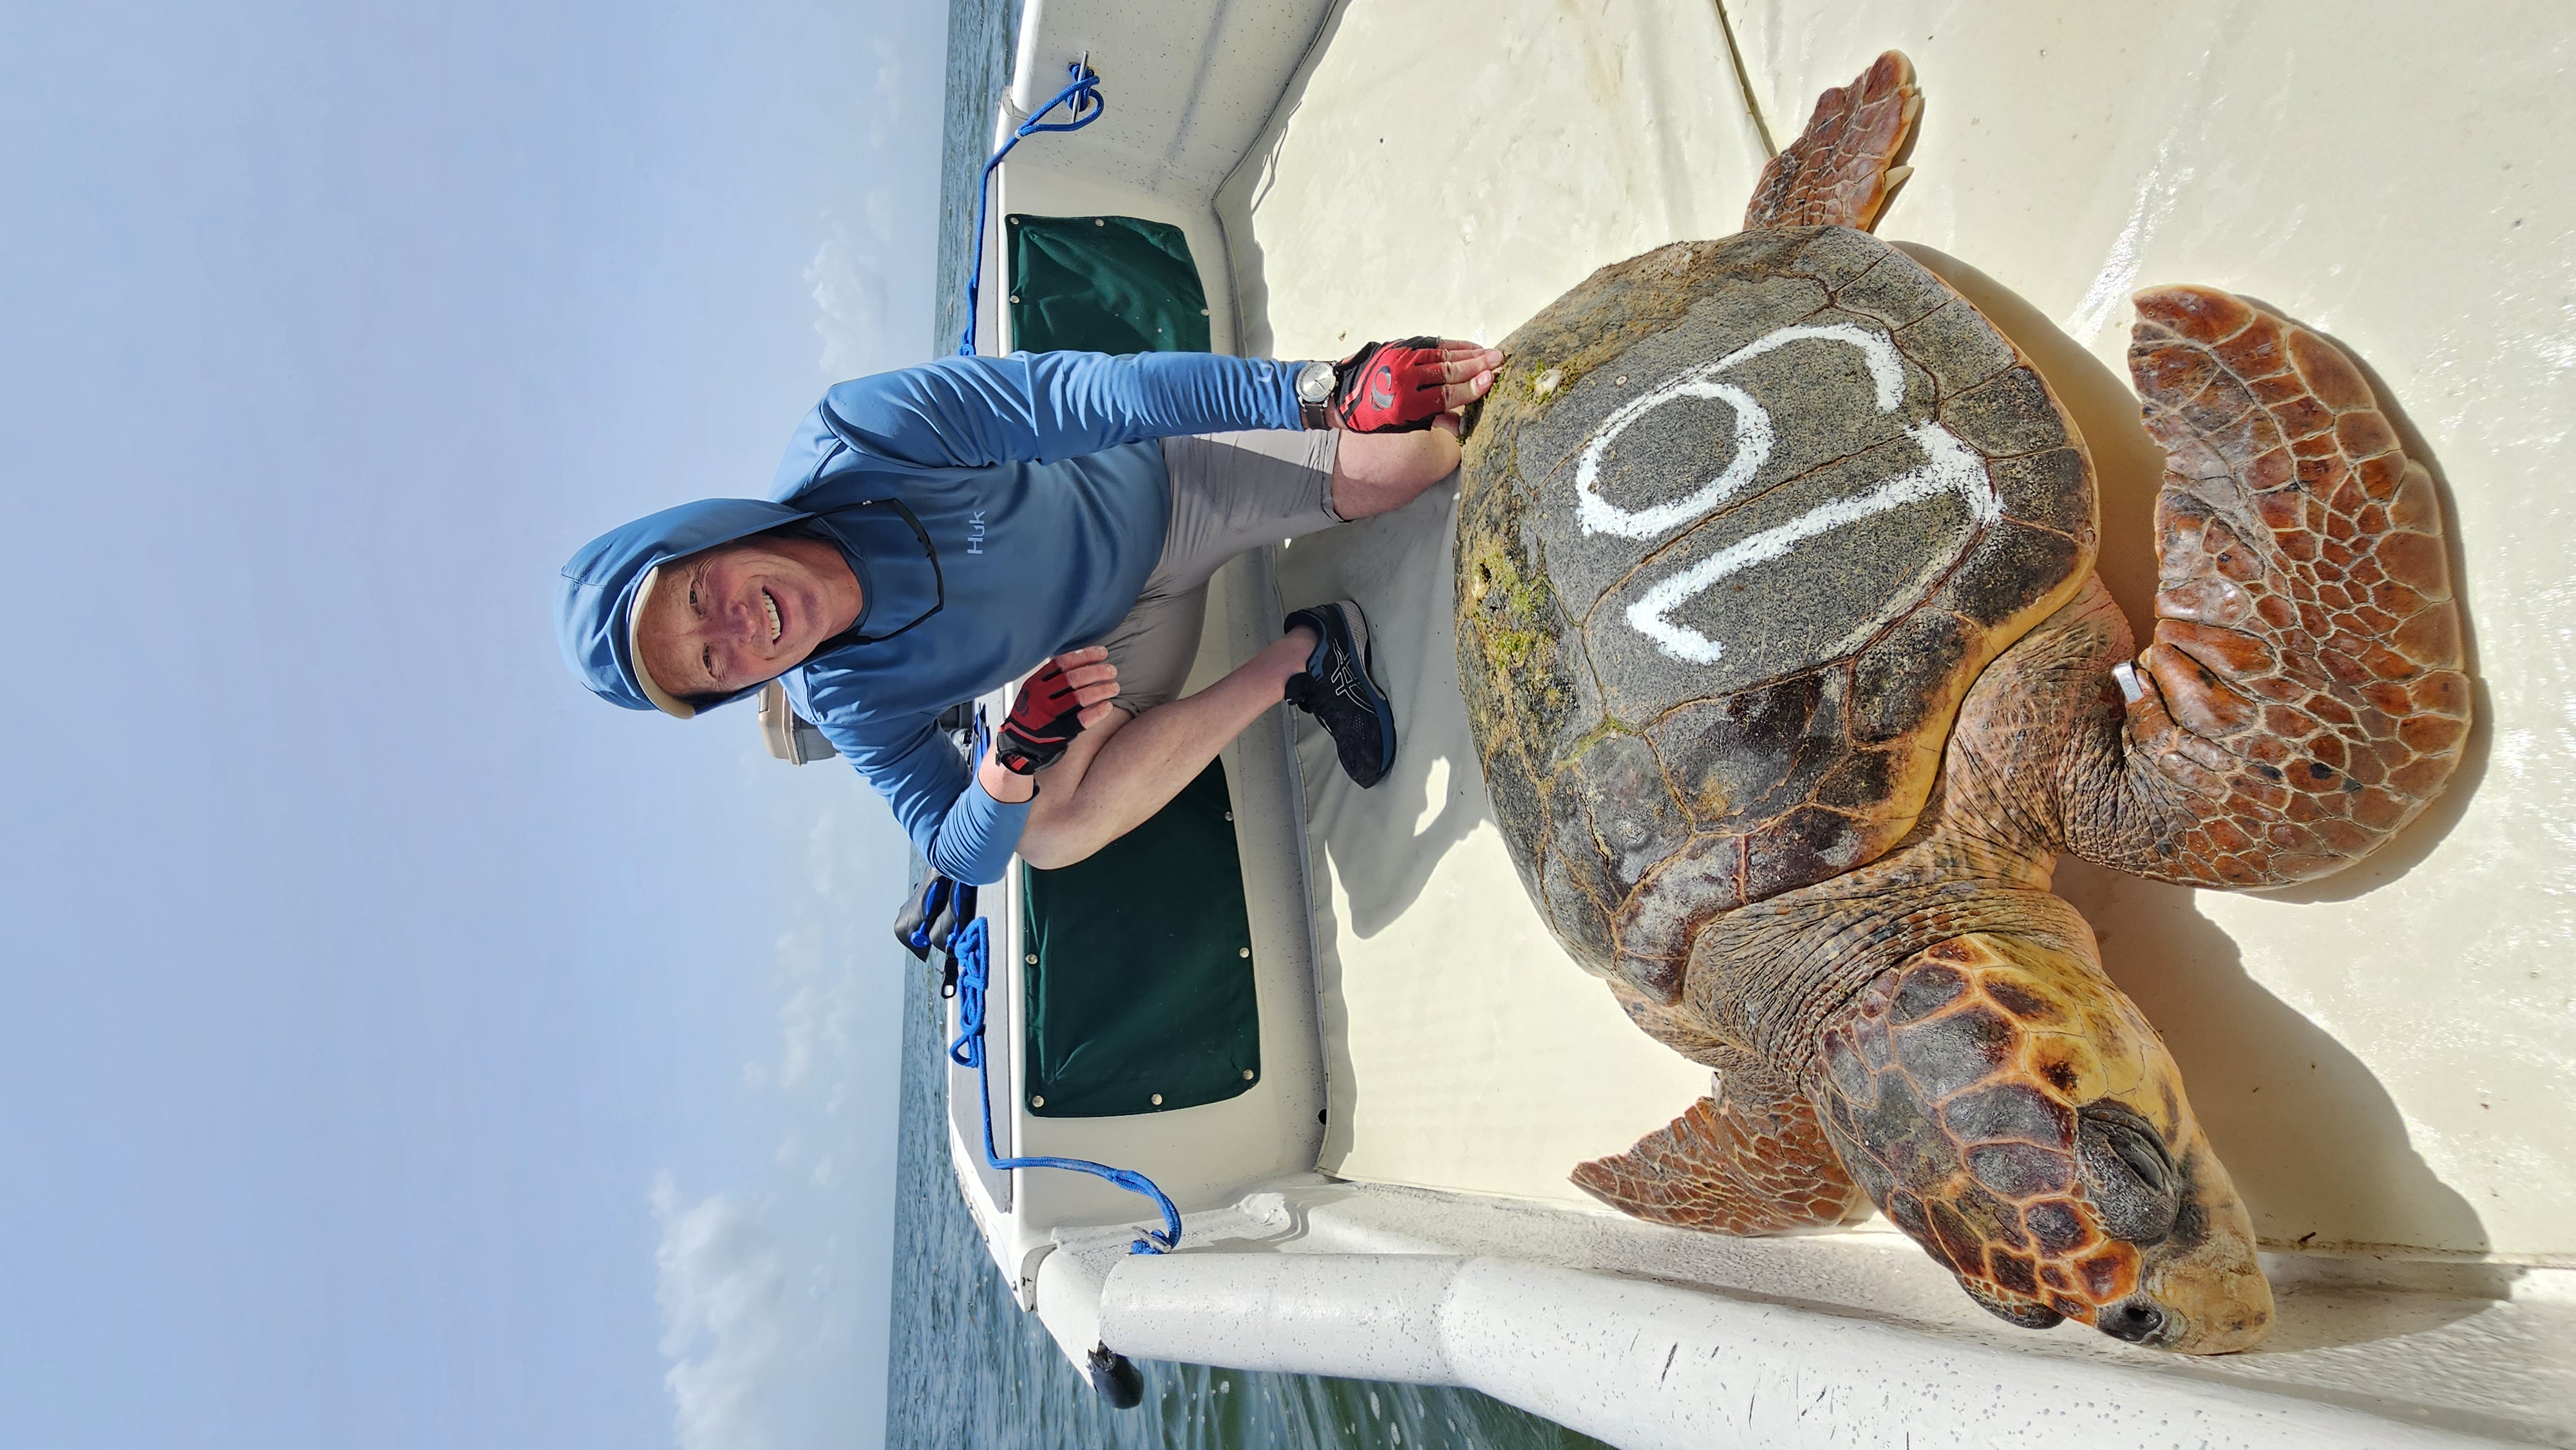
A processed loggerhead ready for release, marked with a non-toxic paint number visible from the surface. Within-season re-sights of numbered turtles like this one provided the recapture data behind our second abundance method – the closed-population Schnabel census. This work was conducted under State of Florida Marine Turtle Permit MTP-124, Everglades National Park Permit EVER 2001-SCI-0053, EVER-2003-SCI-0002, EVER-2004-SCI-0064, EVER-2005-SCI-0060, EVER-2007-SCI-0045, EVER-2009-SCI-0047, EVER-2011-SCI-0023, EVER-2012-SCI-0030, EVER-2013-SCI-0040, EVER-2012-SCI-0030, EVER-2013-SCI-0040, EVER-2015-SCI-0042, EVER-2017-SCI-0039, and EVER-2025-SCI-0014 and National Marine Fisheries Service ESA permits 1198, 1501, 14622, 19637, 25691.
What We Found
A few highlights from the results:
- Green turtle numbers increased dramatically, rising from fewer than 100 individuals annually at the start of the study to more than 600 by the end — a striking positive trend over the 19-year period.
- Loggerhead abundance held steady, with no significant trend detected. Three independent analytical methods (distance sampling, closed mark-recapture, and spatially explicit open mark-recapture) all converged on annual estimates of roughly 537–597 loggerheads — a reassuring sign that the estimates are robust.
- Survival rates for loggerheads were high for adult males, adult females, and immature females (≥0.90 per year for all three groups), while immature males had somewhat lower annual survival (0.75).
- These are the first survival estimates for Northwest Atlantic loggerheads derived from a foraging area study, making them a valuable addition to our understanding of this population.
Why It Matters
Foraging habitats are critical to sea turtle life history, and understanding what’s happening to turtles between nesting events has long been a gap in our knowledge. This study shows that sustained, carefully designed monitoring at foraging areas can yield reliable, publication-quality demographic data — and that the investment pays off over time.
We hope this work serves as a useful template for similar efforts elsewhere. If you have questions about the methods or the data, feel free to reach out!
References
Borchers DL, Efford MG (2008) Spatially explicit maximum likelihood methods for capture–recapture studies. Biometrics 64: 377– 385.
Buckland ST, Rexstad EA, Marques TA, Oedekoven CS (2015) Distance sampling: methods and applications. Springer, Cambridge.
Bresette MJ, Witherington BE, Herren RM, Bagley DA and others (2010) Size-class partitioning and herding in a foraging group of green turtles Chelonia mydas. Endangered Species Res 9: 105– 116.
Chao A, Huggins RM (2005) Classical closed population models. In: Amstrup SC, McDonald TL, Manly BFJ (eds) The handbook of capture– recapture methods. Princeton University Press, Princeton, NJ, p 22– 35.
Schnabel ZE (1938) Estimation of the total fish population in a lake. Am Math Mon 45: 348– 352.